
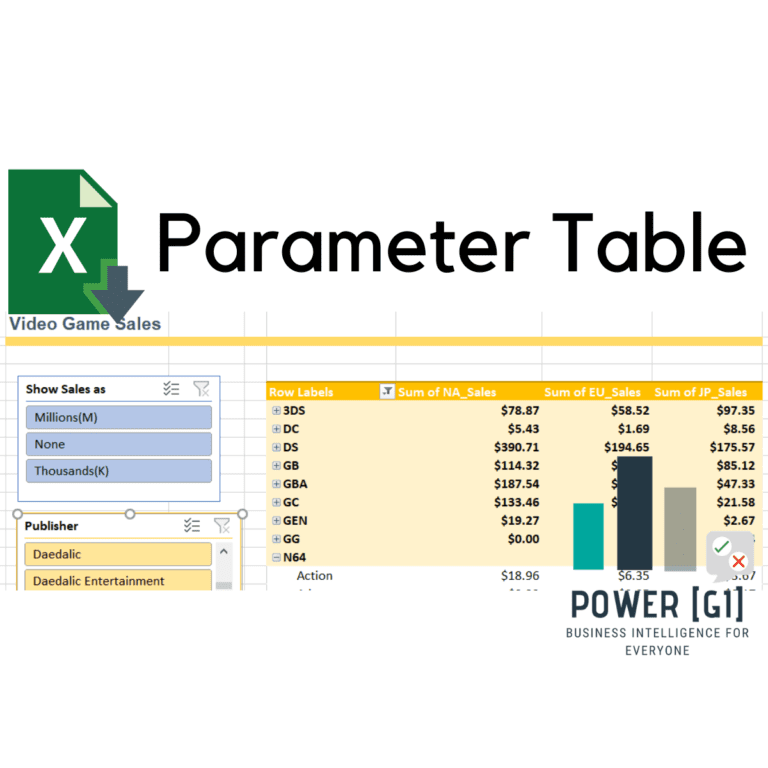
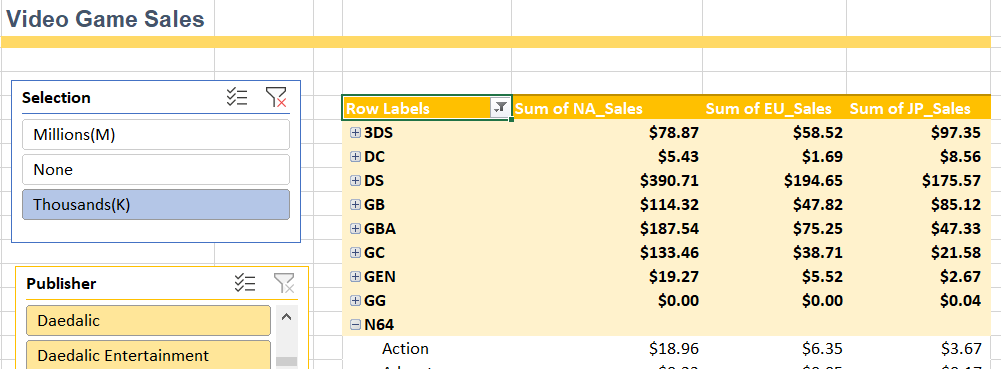
Suppose we have a table with a measure such as Sum of sales amount, and we would like to give the user the ability to change the way the amounts are shown, using a slicer.
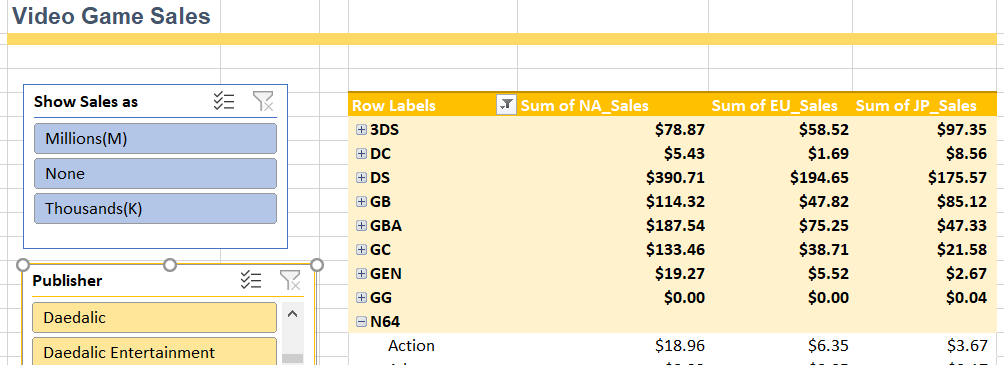
The blue slicer in above example allows the user to change the Sum of sales amounts to be displayed as: Millions(M), Thousands(K) or to be shown as they are in the table.
This is a very simple trick that leverages the usage of a function called HASONEVALUE (), this formula returns true or false if the column used as parameter, has only one distinct value in the current filter context.
This approach is commonly used in Power Platform consulting to enhance data interaction and user experience in reports.
As a leader in Power Platform consulting services, we are committed to transforming the way businesses harness their data. Our expert consultants collaborate closely with you to tailor solutions that maximize efficiency and drive results. Whether it’s implementing advanced data slicers or automating complex tasks, we ensure a seamless integration with your existing systems, empowering you to make data-driven decisions with ease. Explore how we can elevate your data strategy today.
How to do it?
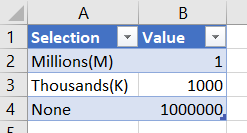
1.Based on our example above, create a table for the parameter you want to add.
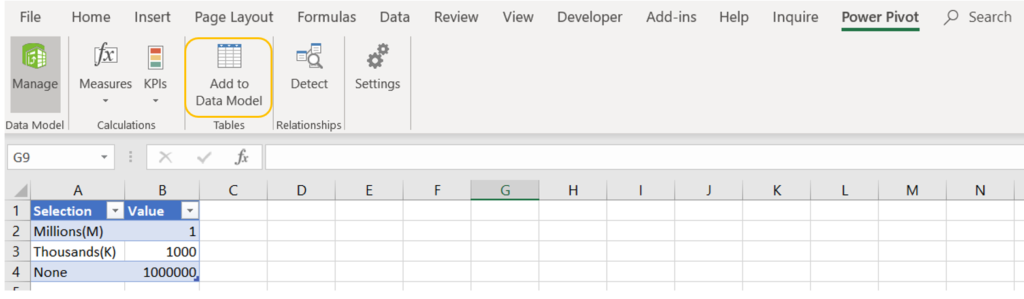
2. Add this table to the data model.
3. Create a slicer in your pivot table, using the table we just created.
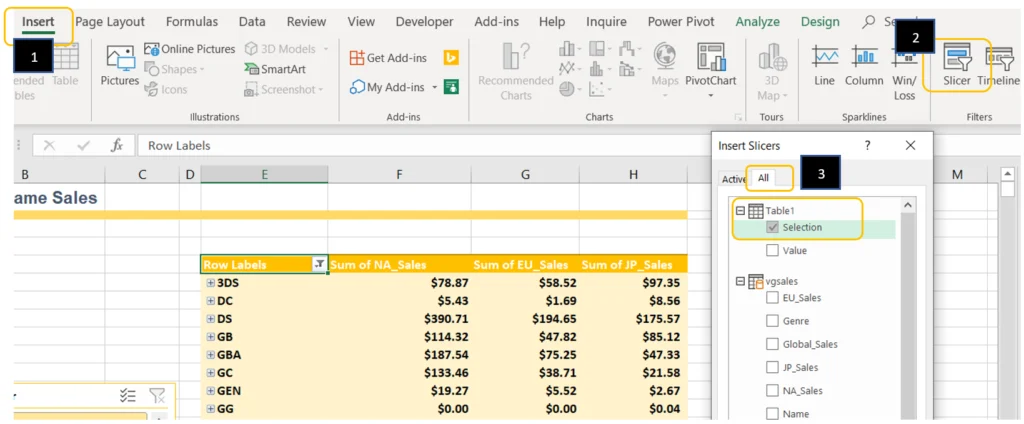
For now the slicer won’t do anything when an option is selected…
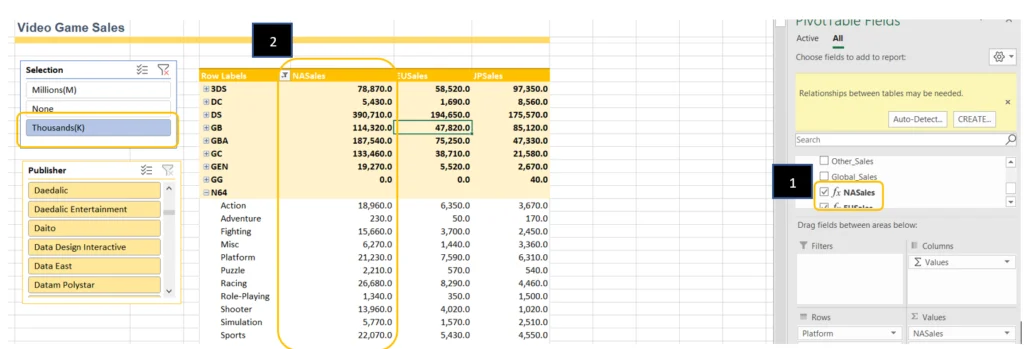
4.Create a sum of sales measure or modify the existing measure to look like this:
NASales :=
IF (
    HASONEVALUE ( Table1[Selection] ),
    SUM ( vgsales[NA_Sales] ) * VALUES ( Table1[Value] ),
    SUM ( vgsales[NA_Sales] )
)
The way to read the formula is the following:
IF (
    HASONEVALUE ( Table1[Selection] ), //When the users click on one value of the slicer, this
                                        expression returns true, because only one distinct value is
                                        selected in the parameter table,
    SUM ( vgsales[NA_Sales] ) * VALUES ( Table1[Value] ), //We then multiply the sum of sales by the
                                                            parameter value of our table, the
                                                            expression VALUES() returns a scalar value
                                                            when the column in the parameter has only
                                                            one distinct value.
    SUM ( vgsales[NA_Sales] ) // If the user selects multiply values or makes no selection in the
                                 slicer we just show the sum of sales according to the original data.
)
5. Add the new measure to the pivot table and use the slicer to change its value.
You can use this function to add new ways to interact with your pivot tables, like giving the user the ability to select currency conversions, rounding, taxes, goals % and more.