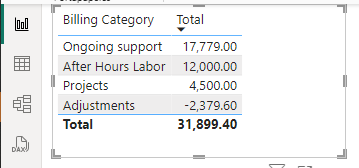
We want to analyze how invoicing works in our company, and we would like to find out which service category is the one we’re selling the most and which we could improve. So, we pull data related to all invoices we’ve sent to clients, and we find the following table:
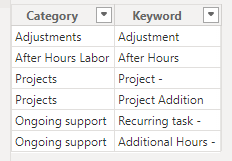
- Adjustments
- After Hours Labor
- Projects
- Ongoing support
Create a Category – Keyword table
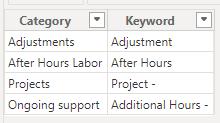
If different words map to a single category, just add a new row in the table for each of the different variations the group could have:
Add a calculated column in the invoice lines table
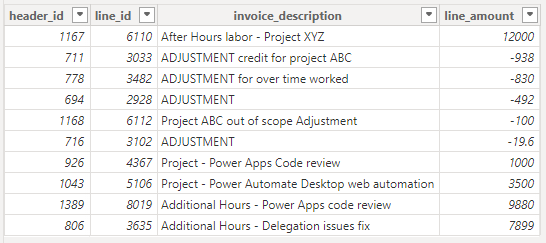
We have two tables:
- Invoice Details
- Keywords
We want to check the “invoice_description” column in each of the rows and see if any of the keywords listed in the Keywords table are contained in this description.
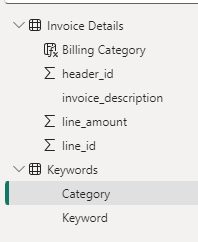
If there is a keyword that matches, we want to get which category the match is for.
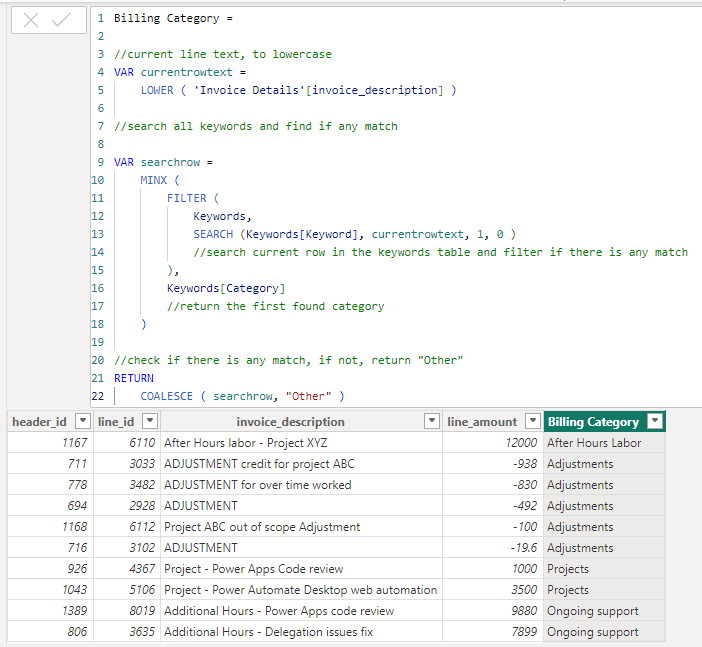
					Billing Category =
//current line text, to lowercase
VAR currentrowtext =
    LOWER ( 'Invoice Details'[invoice_description] )
//search all keywords and find if any match
VAR searchrow =
    MINX (
        FILTER (
            Keywords,
            SEARCH (Keywords[Keyword], currentrowtext, 1, 0 )
            //search current row in the keywords table and filter if there is any match
        ),
        Keywords[Category]
        //return the first found category
    )
//check if there is any match, if not, return "Other"
RETURN
    COALESCE ( searchrow, "Other" )
Use the new column in your visualizations
Now we’re more than ready to start analyzing our data with the new category table we added!