

Histograms are a great way to explore data and to see how it’s distributed among different dimensions. Today we will be looking at book ratings data to try to answer a couple of questions using Power BI visualizations.
Book-Crossing Dataset
The dataset contains 3 tables:
- BX-Book Ratings
- BX-Books
- BX-Users
You can find and download the free dataset in https://www.kaggle.com/ruchi798/bookcrossing-dataset/notebooks. (make sure to upvote to support the user) We would like to answer these questions:
- Do we become more forgiving with how we rate our books as we age? Or do we become harsh critics?
- How does the rating average change by publication year, is old better than new? Is the availability of books playing a bigger role in the rating averages?
- What book can you recommend to someone is his late 30’s
Data Prep
As a little disclaimer, the dataset is not in the best shape. There are some bad quality fields and duplicated records in the unique keys.
We also took the liberty to exclude some irrelevant and seemingly wrong inputs i.e. User Age = 300. Feel free to see all transformations in the .PBIX file attached at the end.
The resulting data model :
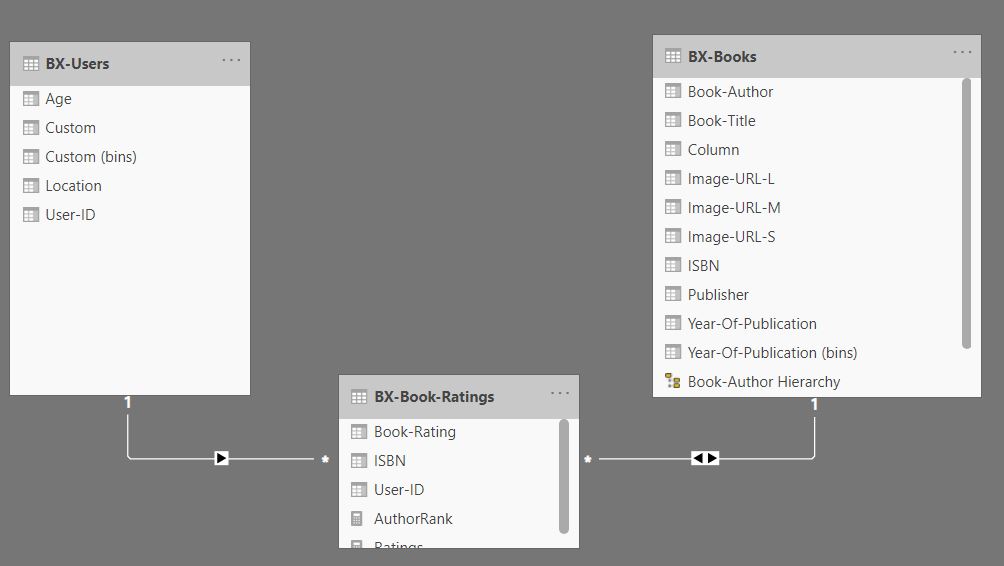
One to many relationship between BX-Books and BX-Book Ratings, using the book’s [ISBN]
We’ll build a dashboard that looks like this:
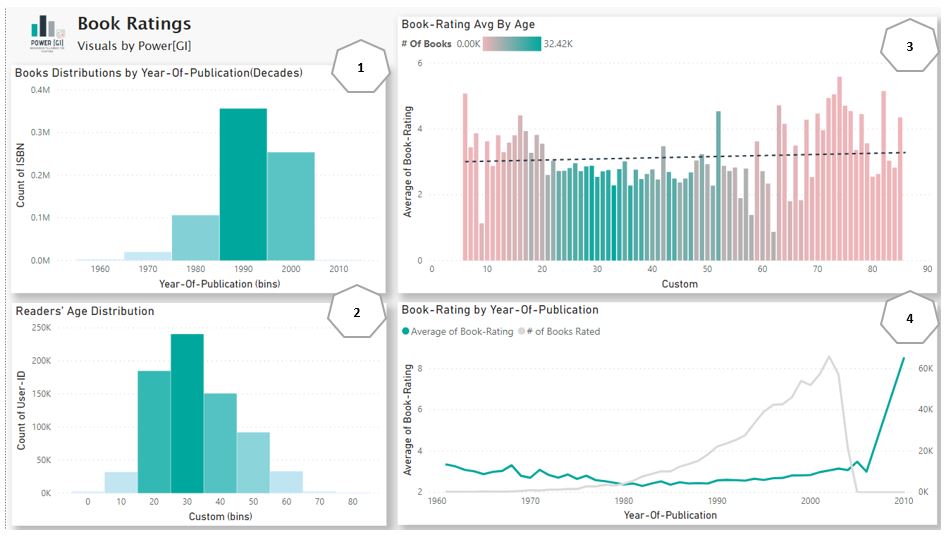
1.Books Distributions by Year of publication
Let’s explore the data by looking how the rated books in the dataset are distributed in each decade, for that purpose we created bins based on the field BX-Books[Year of Publication].
Bins: right click the year of publication from the field pane and select new group, select group type = bin, bin type: size of bins and bin size = 10
Column chart
Axis: Year of Publication(Bins)
Values: Count of BX-Book ratings[ISBN]
The visual is sorted by Year of Publication (BIN)
Data colors: Conditional formatting based on the count of books to generate the different shades shown.
2.Readers Distribution by Age group
We do the same as with the previous chart but now with the readers rating the books, we created bins for the age(size of 10), in our case we added a custom age field to remove some inconsistencies.
Column chart
Axis: Custom(bins)
Values: Count of BX-Book-Ratings[User-ID]
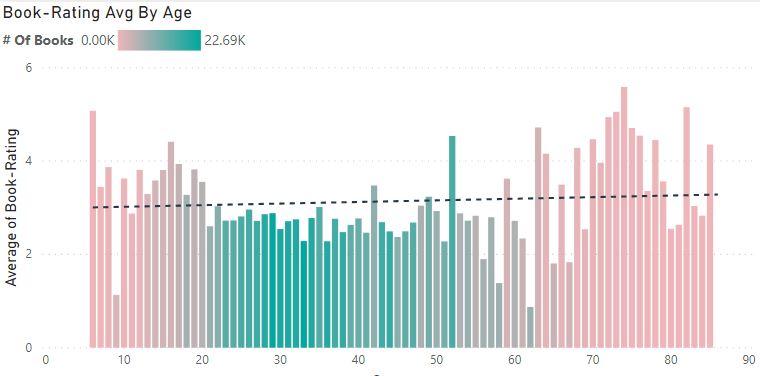
3.Rate averages by Age
Column chart
Axis: Custom age(continuous)
Values: Avg of BX-Book-Ratings[Book-Ratings]
Analytics: Trend line: color black and dashed
Color: Conditional formatting color based on count of [ISBN]
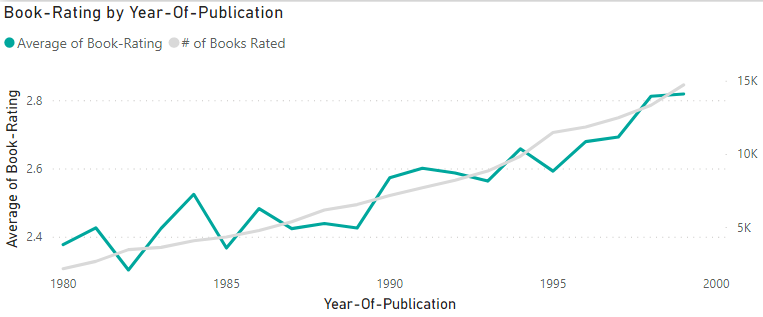
4.Book Rating by publication year
Line Chart
Axis: Bx-Books[Year of Publication]
Values: Avg of BX-Book-Ratings[Book-Ratings]
Secondary values: Count of BX-Book-Ratings[ISBN]
Interactions: All visuals are set to “filter” and not “highlight”
1. Do we become more forgiving with how we rate our books as we age? Or do we become harsh critics?
We see a slightly upward trend in the rates as we age:
It’s interesting to note, that we do start by giving out better ratings and as we progress thru our 20’s, rates average start to drop (use age distribution to filter):

Our 30’s are more or less steady:

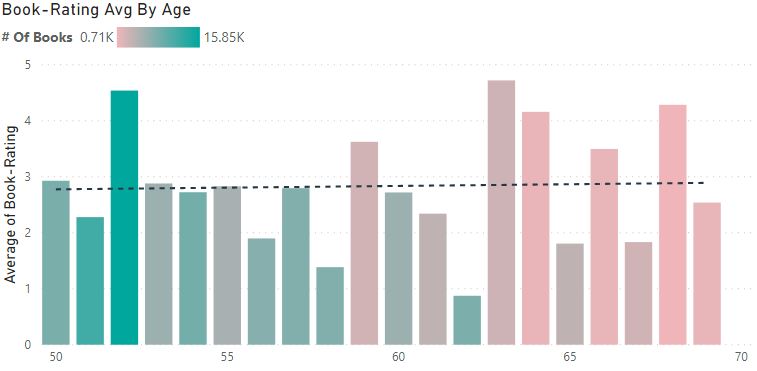
And start to climb back up as we move towards our 60’s:
2. Is old better than new?
Let’s look at 2 decades, 80’s & 90’s
It seems that we are getting better rates in the late 90’s but part of this increase may come from the difference in # books rated (2k early 80’s vs 14k late 90’s).
3. What book can you recommend to someone is his late 30’s?
We created an additional dashboard to rank authors based on the book rating average, we can then filter them by readers’ age & book count higher than 4.
The Dashboard has a matrix with the authors, the rank measure and the count of books.
In the bottom part there is treemap to show titles by the author selected in the matrix and an additional custom visual called “Image grid” to display the book covers using the URL’s from the dataset.
Lets select age group 36,37,38,39, and pick one of the top authors with 5 books or more.
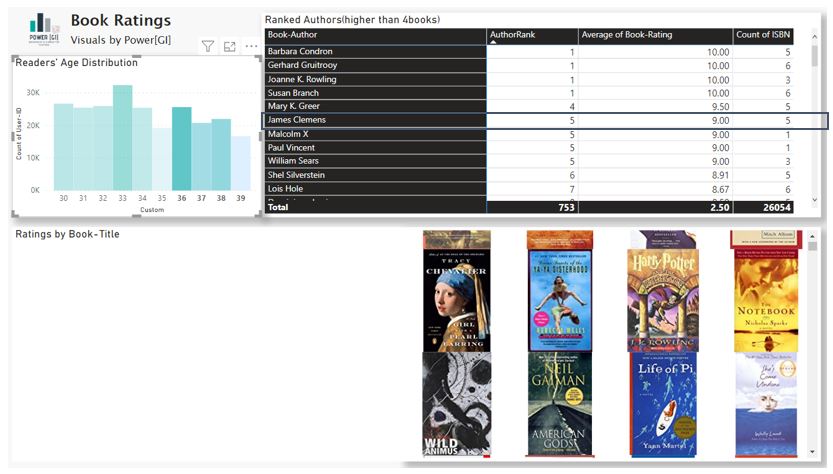
James Clemens:
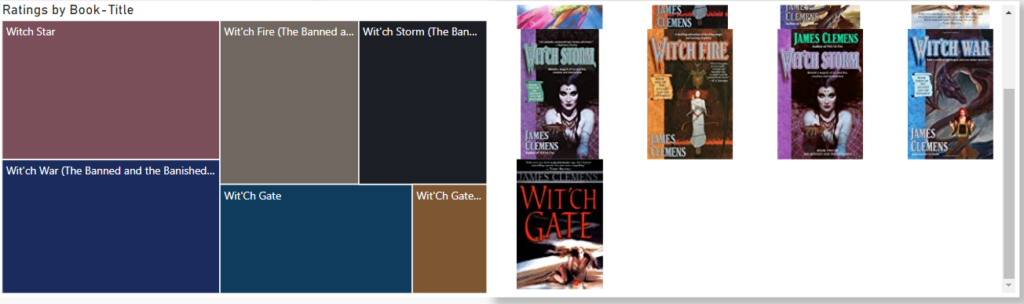
Alright we can start by reading his Witch Series. We may not want to start with “Witch Star” as it is number 5 in the series, but we are exited to say it’s his best rated!